

Nov 21, 2014 The Art of Valuation Jujitsu : Part 3
Most investors don’t realize that the average stock fluctuates by 50% in any given year from its low to its high. If you’ve properly estimated a stock’s value and you’re patient, there should be more than enough opportunities to buy fundamentally strong companies at attractive valuations…which is the key to long-term success in the stock market.
In this post, I am going to demonstrate how a relative value analysis is conducted on a publicly traded company. To do so, I’m going to use three case studies: 21st Century Fox (FOXA), HCA Holdings (HCA), and Abbott Labs (ABT).
21st Century Fox
21st Century Fox is a diversified international media and entertainment company with multiple high growth businesses. The company’s operating segments include Filmed Entertainment (20th Century Fox), TV (FOX Broadcast Network), Cable Networks (Fox News Channel, FX) and Direct Broadcast Satellite TV (Sky Italia, Sky Deutscheland). The company also has significant equity investments in direct-to-home satellite TV provider British Sky Broadcast. I recommended FOXA in July 2014. As part of my recommendation, I included a comparable company analysis; see the figure below.
|
|
|
|
EV/ |
FY14-17 |
Price/ |
FY14-17 |
|
Debt/ |
|
Company |
Fiscal |
Enterprise |
EBITDA |
EBITDA |
Earnings |
EPS |
Debt/ |
Enterprise |
|
Name |
Period |
Value |
NTM |
Growth |
NTM |
Growth |
EBITDA |
Value |
|
Fox |
03/31/2014 |
95,091.1 |
12.05x |
16.80% |
19.71x |
25.7% |
2.99x |
20.04% |
|
|
|
|
|
|
|
|
|
|
|
Average |
|
55,570.9 |
10.51x |
7.71% |
17.62x |
15.69% |
2.03x |
22.10% |
|
Median |
|
42,417.1 |
10.65x |
7.70% |
18.77x |
14.60% |
2.14x |
22.53% |
|
|
|
|
|
|
|
|
|
|
|
CBS |
03/31/2014 |
41,639.8 |
10.63x |
5.40% |
15.86x |
16.6% |
2.14x |
19.20% |
|
Disney |
03/29/2014 |
163,475.4 |
10.75x |
7.70% |
18.95x |
12.1% |
1.19x |
9.55% |
|
Viacom |
03/31/2014 |
47,372.4 |
10.02x |
7.90% |
13.71x |
15.1% |
3.08x |
28.24% |
|
Time Warner |
03/31/2014 |
79,382.8 |
10.68x |
8.40% |
16.45x |
14.5% |
2.57x |
25.56% |
|
Discovery |
03/31/2014 |
24,144.7 |
9.06x |
10.50% |
19.08x |
22.8% |
1.89x |
28.65% |
|
AMC |
03/31/2014 |
7,219.9 |
9.60x |
7.50% |
14.96x |
14.60% |
2.53x |
38.39% |
|
Scripps |
03/31/2014 |
13,364.1 |
10.72x |
6.60% |
19.75x |
14.10% |
0.81x |
10.36% |
21st Century Fox traded at a modest premium to its peers in July. Using next twelve months P/E, the company is trading at 19.7x earnings vs. the group average of 18.7x despite having a much higher expected EPS growth rate (25.7% vs. 14.6% for the group). Similarly, the stock trades at 12x EBITDA vs. 10.7x for the group despite having forecasted EBITDA growth of 16.8% vs. only 7.7% for the group. As noted in Part 2, companies with similar growth rates should trade at similar multiples. Given FOXA’s much higher growth rate, this comparative analysis indicates that there is room for multiple expansion relative to the peer group as investors better understand the company’s growth profile
HCA Holdings (HCA)
In April 2014, I recommended a position in HCA Holdings. HCA is the largest hospital player in the U.S. At the time, there were a lot of moving parts…changes in reimbursement model, the 2-midnight rule, etc. stemming from the implementation of Obamacare. For that reason, my near-term estimates were conservative and below consensus. Provided below is an excerpt from my report.
Estimates
My 2014-2017 estimates are $3.65 (cons: $3.69), $4.50 (cons: $4.32), $5.10 (cons: $4.90), and $5.70(cons: NA), respectively. My secular earnings growth estimate is +13%, which is comprised of +6% revenue growth, +2% operating margin contribution, and +5% from capital deployment.
- Revs (+6%) – High local market share in fast-growing markets combined with a service business opportunity, point to a higher organic profile. Revs should increase by +6% over the next several years driven by a combination of higher patient revenue and lower bad debt expense.
- Operating Margin (+2%) – HCA’s average market share by state of 12% is nearly double its nearest competitor at 7%, driving superior asset returns with EBITDA margins of ~19% vs. peers at ~12%. That said, with already high margins I am only expecting margins to contribute +2% to annual EPS growth.
- Capital Deployment (+5%) – With solid FCF, the issuance of a new repurchase program following incremental debt retirement in 2H14 seems increasingly likely. 2013 OCF was $3.7B with FCF of $1.7B (7% of market cap). The previous repurchase was completed in 4Q13. HCA recently announced refinancing of some of its notes. After these notes are refinanced, HCA can redo its covenants to allow for a bigger share repurchase and/or a special dividend.
Valuation
The stock currently trades at 13.3x my 2014 estimate and 11.5x my 2015 estimate. This equates to a relative multiple of 0.86x. My valuation estimate of $59 PT reflects a fair value multiple of 1.05x, which better reflects the anticipated +13% earnings growth from the implementation of the Affordable Care Act (ACA). The $59 estimate represents 8.4x 2014 EBITDA, near the midpoint of its historical 6-10s multiple range when HCA was previously public. Upside to my estimate would be driven by a greater-than-expected benefit to EBITDA from healthcare reform. Downside would come from weak hospital utilization and/or less reduction in bad debt expense from ACA. The company does not pay a dividend.
I compared my price target to that of the sell-side analysts following the stock. The median PT for the Street was $57 (+17% upside). The median PT for the best analysts was $60 (+23% upside). I define “best” as those analysts ranked first, second, or third in Institutional Investor’s annual survey. My $59 estimate implies ~21% upside in the stock. If hospital utilization increases (and bad debt expense decreases) meaningfully from the Affordable Care Act, my PT may prove conservative.
Abbott Labs (ABT)
Abbott Labs is a diversified global healthcare company with products in five categories: Pharmaceuticals (57% of revenues), Nutritionals (16%), Diagnostics (11%), Vascular (9%), and Diabetes Care (5%). The company generated $35.2 billion in sales in 2010. The geographic mix was 43% U.S. and 57% outside the U.S. Some of the company’s well known brands include: 1) HUMIRA, the leading biologic for the treatment of Rheumatoid Arthritis, 2) infant and adult nutritionals such as Similac and Ensure, 3) the coronary stent, XIENCE, and 4) the FreeStyle family of blood glucose monitoring systems for diabetics.
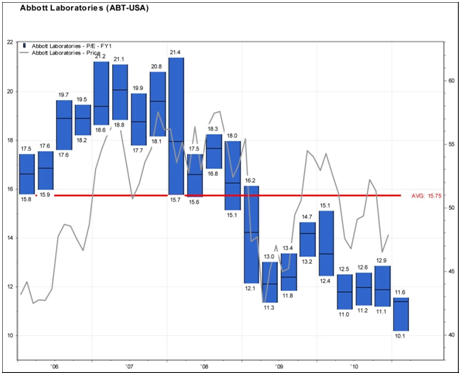
Source: FactSet Estimates and Interactive Data Corp via FactSet
The figure above reflects the quarterly P/E ratio from 2006-2011. The blue bars in the figure illustrate the P/E range in each quarter. In the second quarter of 2006), the stock traded at a P/E multiple that ranged from 15.9x to 17.6x. The black line that bisects the blue bar is the average multiple for that quarter (16.8x in 2Q06), and the red line that bisects the entire graph reflects the average multiple for the entire period (15.75x for the 5-year period depicted). These graphs can sometimes be used to identify inflection points in the stock meriting action.
From the figure, we can see that the peak and trough multiples over the 5-year period were 21.4x and 10.1x, respectively. In January 2011, the stock is trading at 10.3x, which is near its trough multiple. What is particularly noteworthy is that Abbott’s P/E multiple didn’t even reach this low in 2008 amidst the financial crisis. This suggests that either the stock is historically undervalued, or something has changed, either at Abbott or in the pharmaceutical industry, to suggest that the stock will be in a new era of lower P/E ratios. To get an idea, let’s look at the consensus growth rate for the company. Given the Street is forecasting double digit earnings growth for the next several years and the company has the free cash flow to support the 3.7% dividend yield, I’m inclined to believe the stock is historically undervalued.
We can use the 5-year P/E range to approximate the upside and downside on the stock. Using the peak multiple of 21.4x and the 2011 EPS estimate of $4.58, the stock could reach as high as $98 per share.
Expected Stock Price Using = 2011 EPS Est. x Peak P/E
Peak Multiple
= $4.58 x 21.4x
= $98.01
With the stock currently at $46.95, the upside to $98 would represent a 108% return. On the other hand, the trough multiple of 10.1x implies downside risk of 2% to $46.25.
Expected Stock Price Using = 2011 EPS Est. x Trough P/E
Trough Multiple
= $4.58 x 10.1x
= $46.25
Looking at a potential upside gain of 108% and a likely downside risk of only 2% (an upside/downside ratio of 54:1), the stock looks very attractive based on the 5-year P/E range. However, this upside/downside rate seems unrealistic; for context, a range of 3:1 or 4:1 is what many investors look for when picking stocks. Looking again at Figure 19.12, the P/E trend has been declining for over three years suggesting that it may be a secular trend to a sustainably lower P/E range, not a rotational move. However, since no reason for a sustained lower P/E stands out in terms of company growth prospects, cash flow, or dividend sustainability, it is reasonable to assume that rotation is the major factor driving the lower multiple. Even so, it may be more appropriate to use the stock’s 5-year average multiple of 15.75x, rather than its prior peak of 21.4x when estimating potential upside.
Expected Stock Price Using = 2011 EPS Est. x Average P/E
Average Multiple
= $4.58 x 15.75x
= $72.13
If Abbott’s stock can regain it average multiple of 15.75x, the stock would trade at $72. With the stock currently at $46.95, there is 53% upside to $72. For downside risk, we have no historical P/Es to guide us. In a situation like this, I make the assumption that the stock has 10% downside risk. From $46.95, 10% downside would be $42.25. With the current annualized dividend of $1.82, and the assumed $42.25 price, that would produce a yield of 4.3%, a compelling level for a company with Abbott’s cash flow and growth prospects. Using the average multiple (rather than the peak multiple) and the 10% downside assumption, (rather than the trough multiple), the upside/downside ratio would be 5:1 (53% upside divided by 10% downside), which is very attractive (particularly when combined with the 3.7% yield). Even if we assumed the stock had 20% downside to $37.56 (producing a very compelling 4.8% dividend yield) the upside/downside ratio would still be favorable at 2.7:1.
Given these dynamics, I recommended ABT in January 2011 when the stock was under pressure.
No Comments