

Nov 24, 2014 The Art of Valuation Jujitsu : Part 4
In Part 1 of The Art of Valuation Jujitsu, I noted that valuation methods can be broken into two basic categories: absolute and relative value techniques. Here, I am going to focus on absolute value techniques. Specifically, I am going to discuss the theory behind them. Then, in Part 5, I will apply these techniques to a publicly traded company.
With absolute value models, a stock’s value is estimated based on the company’s future cash flows. Among the various types of absolute value models, the free cash flow to the firm (FCFF) model is the most commonly used. Let’s begin by defining free cash flow, and then look at an example of how it is calculated. As the name implies, free cash flow represents the cash available for distribution to investors after the company has made the necessary investments in working capital and fixed assets needed to support the company’s ongoing operations.
FCFF can be calculated in a couple different ways. Using the information on the company’s cash flow statement, FCFF is operating cash flow minus capital expenditures.
Operating cash flow
– Capex
= Free cash flow to the firm
If you’re looking at how much free cash flow the firm has generated in the PAST, then this is the simplest calculation. But remember, a stock valuation is based on FUTURE cash flow. To estimate future cash flow, I find it more instructive to calculate FCFF using after-tax operating income, which is denoted EBIT (1 – T).
EBIT (1 – T)
+ Depreciation
– Increase in Working Capital
– Capex
=Free cash flow to the firm
Don’t get overwhelmed with the formulas. It’s easier than it looks. To see this, let’s revisit EverConnect. The company generated $60 million in revenues in 2013. The operating margin was 33%. Operating margin is the amount of operating income that a company generates per dollar of revenue. So, in this case, the company generates $0.33 in operating profit for every $1 in sales. If EverConnect’s tax rate is 40%, the after-tax operating income would be $12.
60 Sales
X 0.33 OM
= 20 EBIT
– 8 Taxes
= 12 After-tax EBIT
The $8 million in taxes is determined by multiplying the $20 million in operating income by the company’s 40% tax rate. In this case, we assumed the tax rate was 40%. You can estimate a company’s tax rate by dividing taxes by earnings before taxes.
calculate FCFF we have to adjust after-tax operating income for non-cash charges and reinvestment. If you look at the income statement of a company, you will see that operating income is calculated by deducting Cost of Goods Sold, SG&A Expense, R&D Expense, and Depreciation Expense from Total Sales. Of these various expenses, depreciation is the only “non-cash” expense, meaning that is an accounting estimate of the fixed assets used during the period. As a result, we add this non-cash expense back when calculating free cash flow. We also have to adjust after-tax operating income for “reinvestment.” You can think of reinvestment as the money needed to sustain the company at the current level. That would include investments in short-term assets (i.e., working capital) and long-term assets (i.e., capital expenditures or capex). Since these both represent cash outflows, they are typically deducted when calculating free cash flow. In this case, the working capital investment in 2013 was $3 million and the fixed capital investment was $12 million. Based on this information, we would say that EverConnect’s free cash flow for 2013 was $5 million.
12.00 EBIT (1 – T)
+ 8.00 Depreciation and amortization
– 12.00 Capex
– 3.00 Increase in working capital
= 5.00 Free cash flow to the firm
Looking at analysts’ estimates, it appears that EverConnect’s sales are expected to growth +7% annually for the next 5 years. For simplicity, let’s assume that operating income, depreciation, capex, and working capital are expected to grow in line with sales over that time period. Under these assumptions, FCF during the explicit forecast period would grow from $5.00 in 2013 to $7.01 in 2018.
|
|
2013 |
2014 |
2015 |
2016 |
2017 |
2018 |
|
EBIT (1 – T) |
12.00 |
12.84 |
13.74 |
14.70 |
15.73 |
16.83 |
|
Depreciation and amortization |
$8 |
8.56 |
9.16 |
9.80 |
10.49 |
11.22 |
|
Capex |
($3) |
(3.21) |
(3.43) |
(3.68) |
(3.93) |
(4.21) |
|
Increase in working capital |
($12) |
(12.84) |
(13.74) |
(14.70) |
(15.73) |
(16.83) |
|
Free cash flow to the firm |
5.00 |
5.35 |
5.72 |
6.12 |
6.55 |
7.01 |
After the five years, growth is expected to decline to 3% per year forever. So, in addition to the FCF in 2018 of $7.01, we also have to calculate a terminal value. Terminal values can be calculated in one of two ways. Either we assume a terminal growth rate as we have here (i.e., 3%), or we assume a terminal multiple. If we use a terminal multiple, then the average multiple among the mature companies in the industry is a good starting point.
The general formula for terminal value is provided below.
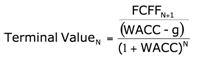
The terminal value in year N (18 in this case) is based on the FCF for the next period, N+1 or 19. The numerator is the FCF estimate for next year divided by the spread between the company’s cost of capital and the terminal growth rate. Since FCF was $7.01 in 2018, and it is expected to grow 3% annually, the FCF for 2019 is $7.22. The 2019 FCF estimate of $7.22 is then divided by 0.05, the spread between the company’s cost of capital of 8% and the terminal growth rate of 3%. In this case, the terminal value in 2018 is $103.16 ($7.22 / (0.08 – 0.03)). With this, we have all the pieces needed to estimate the value of the company. To do so, we use the following formula.
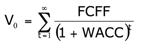
where
V0 = The value of the firm
WACC = we(re) + wd(rd)
In basic terms, this simply says we discount the future cash flows back to today at the company’s cost of capital.
In this case, the value of the company is $94.50. I say “company value” because this is an estimate of what the company is worth. Claims on the company’s assets can be made by both the stockholders and creditors. To arrive at an estimate of the value of the company’s stock we need to deduct the market value of debt. If the value of debt is $24.82, then the value of the company’s stock is $69.70.
Firm value
– Value of debt
= Value of equity
The timeline below illustrates the process of discounting the future cash flows.
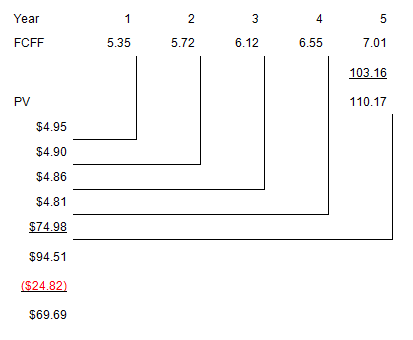
The last step is to compare the company’s current stock price to our estimated value. If EverConnect is currently trading at $54, then we would assume that the stock is undervalued by 29% [($69.70 / $54) – 1]. As a practical matter, we would want to use conservative assumptions in our analysis. If the current market price is much lower than an estimate that was conservatively derived, then we will have more confidence that the stock is truly undervalued and the conviction in our analysis to buy the stock.
With an understanding of how to estimate the value of a hypothetical company using a free cash flow model, we will look at how to derive the value of a publicly traded company in Part 5.
No Comments